
What is your expected return on SIP for 5 years in Nifty 50?
SIPs (Systematic Investment Plan) have become one of the most popular ways for retail investors to invest in equity markets. There is a growing belief amongst retail investors now, thanks to years of education by regulator and market experts that one can get to optimally average one’s entry price in the equity market by investing through a long-term SIP of about 5 years, which in turn can help bring down the risks associated with investing in equity markets dramatically. As a result, a large segment of equity market experts and “influencers” are now of the view that retail investors can very easily generate at least a low-double digit return of 11% to 12% per annum if the invest in a disciplined manner through a SIP over a period of 4-5 years. However, is this a correct notion? Can retail investors really accrue a return of at least 11% to 12% per annum with a very high probability by investing through a SIP for 5 years? Let’s examine!
Historical Performance of a SIP for 5 Years in the NIFTY-50
The historical performance of a 5-Year SIP investment in NIFTY-50 since the turn of this century has been as follows:
Conventional SIP for 5 Years in NIFTY-50
Historical Performance (IRR)
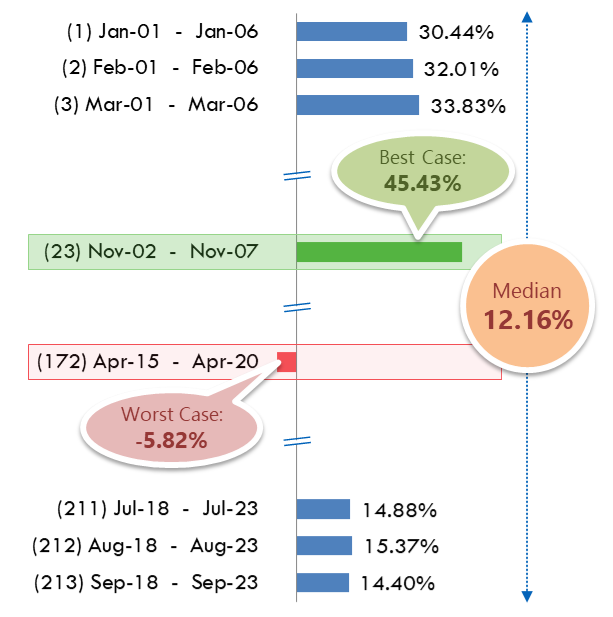
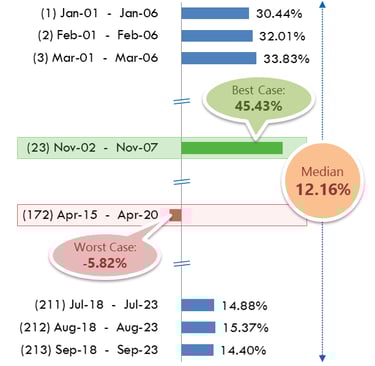
From the above chart capturing the historical performance of the best SIP for 5 years in the NIFTY-50, we can identify two key risks that retail investors have to contend with while investing in the NIFTY through a SIP for 5 Years:
Highly unsuited for achieving financial goals
From the above chart, one can infer that the outcome of a 5-year SIP in the NIFTY almost entirely depended on one single factor – market conditions at the time of the SIP coming to an end. A 5-year SIP in the NIFTY ending in the middle of a strong bull run (e.g. a SIP from Nov-02 to Nov-07 that ended in Nov 2007, when the NIFTY was at its all-time-high) has historically produced returns as spectacular as 45.43% per annum. On the other hand, a 5-year SIP in the same NIFTY ending in the middle of a market crash (e.g. a SIP from Apr-15 to Apr-20 that ended in Apr-2020, when the NIFTY crashed almost 40% because of the onset of the COVID pandemic) has historically ended up with returns as abysmal as minus 5.82% per annum.
This makes it very tricky to plan for financial goals through a SIP. For e.g. if you have a child in your household, who is let’s say, in Class VII right now, and would be going to college after completing his/her Class XII studies in 5 years from now, and you wish to build a corpus of let’s say Rs. 10 lakhs to pay his/her college fees. Given the historical performance of a 5-Year SIP we discussed above, it would be very difficult to plan for this financial goal through a SIP, because the outcome of a SIP over the next 5 years, as we saw above, would almost entirely depend on market conditions at the time this SIP would come to an end 5 years from now. If markets are buoyant at that time, then a SIP over the next 5 years is likely to help generate very good returns and the investor would very likely end up with a corpus much larger than the Rs. 10 lakhs he was targeting. However if equity markets are in the middle a severe downturn 5 years from now, then a SIP over the next 5 years would very likely end up with not just poor, but even negative returns, which in turn would mean that the investor would most probably NOT be able to end up with a corpus of Rs. 10 lakhs that he was targeting to build by the end of his 5-year SIP journey in order to pay for the college admission fee of his child. Surely, one can’t plan for a key life goal such as building a corpus to pay for the college fee of a child based on an investment strategy such as SIP, where the outcome can vary so so wildly! Isn’t it?
But If not a SIP then What?
Is there any alternate investment strategy through which retail investors can generate at least a low-double digit return of 11% to 12% per annum, if they stay the course with their investment journey in a disciplined manner with the best SIP for 5 Years?
Well, please stay tuned, because that’s exactly what we would be discussing in our upcoming blogs.
Very Low Probability Of Even Low Double-Digit Return (11%-12% Per Annum)
The chart above outlines the historical performance of a 5-Year SIP in the NIFTY since Jan 2001. This chart examines the historical return of a 5-year SIP in the NIFTY over various different 5-year periods since Jan 2001, i.e.:
1. Jan 2001 to Jan 2006
2. Feb 2001 to Feb 2006
3. Mar 2001 to Mar 2006
……………………
…………………………………………
……………………
……………………
211. Jul 2018 to Jul 2023
212. Aug 2018 to Aug 2023
213. Sep 2018 to Sep 2023
As can be seen above, there have been 213 distinct 5-year periods in history since Jan 2001. Also, it turns out that had one done a 5-Year SIP investment in the NIFTY during each of these 213 5-year periods, he/she would have ended up with a return of 12% per annum or more in just 109 5-year periods. This effectively means that the historical chances of ending up with a return of 12% per annum or more at the end of a 5-year SIP in the NIFTY has been 109/ 213 = just 51%!
Why do I call this just 51%? Because the probability of getting a toss of a coin right is 50%! This is how the odds are stacked when the outcome completely depends on your luck. So effectively, this means that the historical probability of ending up with a low double digit return of 12% or more at the end of a 5-year SIP in the NIFTY has historically been about the same as the probability of getting a toss of a coin right!
So clearly, the widespread belief amongst market experts and retail investors that they can very easily generate a return of at least 11% to 12% per annum if they invest through a SIP in a disciplined manner for a period of 4-5 years is very very misplaced, to put it mildly.
India's first global-macros driven hedge fund

Address: 307, Indiabulls MINT, Opposite Hiranandani Meadows, Manpada, Thane (West), Maharashtra - 400610 India
© 2026 – metacaps.ai is a registered trademark of ANIINCAPS PRIVATE LIMITED