
How does the Nifty PE Ratio Boost Returns on Investment?
What is PE Ratio?
Every stock has a PE ratio, where the numerator (P) stands for Price of the stock and denominator (E) stands for the Earnings or profit made by the company in the last 12 months.
For instance, if the price of a company’s stock is currently trading at Rs. 20 per share, and let’s say there are 1 crore shares of this stock held by all shareholders put together, then the price one has to pay to buy all the shares of this company (also known as the market capitalisation of the company) would be Rs. 20 x 1 crore = Rs. 20 Crore. The “P” in the PE ratio of this stock is therefore Rs. 20 Crore.
Now, let's come to "E" (earnings). Earning refers to the profit generated by the company in the last 1 year. Let’s assume, the company's profit over the last 1 year has been Rs. 1 crore. In that case, the "E" in the PE ratio of this stock would be Rs. 1 Crore. Hence the PE Ratio of this stock would be Rs. 20 Crore divided by Rs. 1 Crore = 20.
Also note that the Price (P) of a stock changes every trading day, and hence the PE ratio of the stock changes every trading day accordingly.
NIFTY-50 is the primary stock index of our country, and comprises stocks of the 50 largest companies of our country across various industry segments. Each of these 50 stocks has its own PE ratio, which in turn fluctuates on a daily basis. By calculating the average of the PE ratios of these 50 stocks, one can determine the PE ratio of the NIFTY-50 itself on any given day.
Historical Relationship between NIFTY and NIFTY’s PE Ratio
Now how does the NIfty-50 PE ratio help in timing the market?
The red line in the chart below shows how the NIFTY’s PE ratio has moved since the turn of this century.
As can be seen, the long term average of NIFTY’s PE Ratio has historically been 20.01
NIFTY is considered over-valued whenever the prevailing PE ratio goes significantly above its long term average of 20.01, which in turn pushes up the risk of a big correction during such times. In fact, the three largest crashes in NIFTY’s history since the turn of century have all happened when the NIFTY’s prevailing PE ratio went significantly above its long term average. In fact, NIFTY’s PE going above 28, as can be seen in the chart below has invariably triggered a big crash in NIFTY so far:
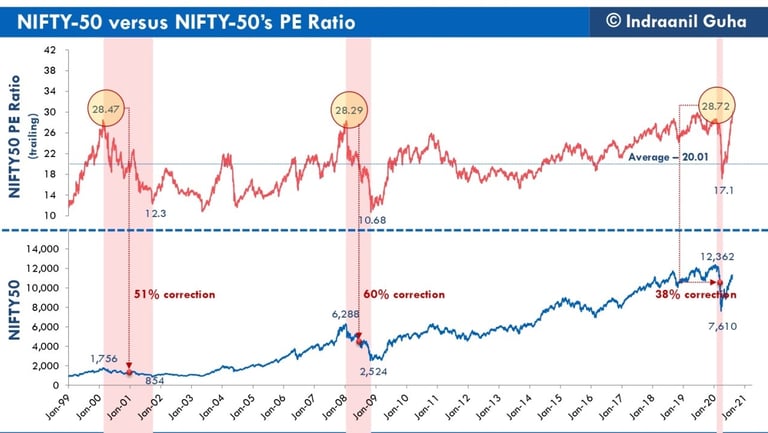
Historical Relationship between NIFTY-50 and NIFTY’s PE Ratio
In the same vein, NIFTY is considered under-valued whenever prevailing PE ratio of the NIFTY goes significantly below its long term average (typically below 17), and therefore, the strongest rallies in NIFTY’s history have all been triggered during such times
Strategy to time the NIFTY based on NIFTY’s PE Ratio
Given the above historical relationship between NIFTY and NIFTY’s PE ratio, a common sense investment strategy would be to reduce equity weightage of an investment portfolio during times when NIFTY 50 PE ratio is very high, and gradually increase equity weightage as the prevailing PE ratio starts to drop.
So here’s an SIP investment strategy that incorporates the above principle to time the NIFTY basis its prevailing PE ratio:
- Invest a fixed amount every month for a period of 5 years (60 months), as you would in case of a conventional SIP
- However unlike in case of a conventional SIP, where the investment amount just stays in the equity fund for the entire duration of the SIP investment, we propose that the SIP portfolio be rebalanced every month basis the prevailing PE Ratio of the NIFTY between any fund or ETF tracking the NIFTY-50 (on the equity side) and any top-rated liquid fund (we have assumed HDFC LIQUID FUND for the purpose of historical back-testing) as per the rule proposed below:

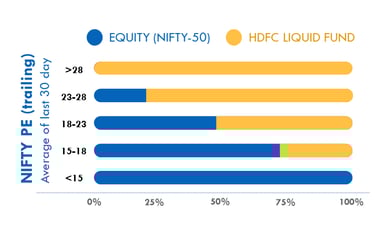
Proposed timing logic to time the NIFTY based on NIFTY’s PE Ratio
- We propose that the rebalancing between NIFTY and Liquid Fund be done on the first trading every month for 5 years
- For e.g. let’s say you have been investing Rs. 10,000 per month as per this strategy for the last 12 months, in which case, you have already invested a total of Rs. 10,000 x 12 = Rs 1.2 lakhs. Let’s assume that the value of this Rs. 1.2 Lakhs has gone up to Rs. 1.3 Lakhs over the last 12 months. Now an additional Rs. 10,000 will get invested in this investment portfolio at the beginning of the 13th months, taking the total value of the portfolio to Rs. 1.4 lakhs
- Let’s assume that the prevailing PE ratio of the NIFTY currently is 20, in which case, going by the above mentioned rule, the proposed allocation for equity in the current month should be 50% and the allocation for debt should be 50%. Accordingly, the Rs. 1.4 lakh SIP investment portfolio should be rebalanced between NIFTY and HDFC Liquid Fund the ratio of 50:50 (i.e. Rs. 70,000 to go to NIFTY and the remaining Rs. 70,000 to HDFC Liquid Fund)
- This rebalancing exercise should be repeated once again on the first trading day of every month for 5 years, based on the prevailing value of the SIP portfolio and prevailing PE ratio of the NIFTY
Historical Performance of the timing logic to time the NIFTY based on NIFTY’s PE Ratio
Before evaluating the historical performance of the above-mentioned timing logic to time the NIFTY based on NIFTY’s PE Ratio, it would be worthwhile to first re-look at the historical performance of a conventional 5-year SIP in the NIFTY-50 (we had examined this here in my last blog) for the purpose of benchmarking.
So here it is… the historical performance of the conventional 5-Year SIP investment in NIFTY-50 has been as follows:

5-Year Conventional SIP Investment in NIFTY-50
Historical Performance (IRR)
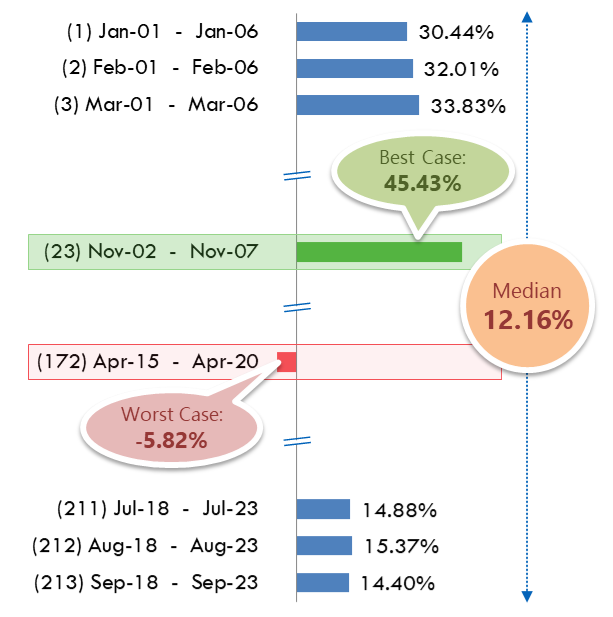
Compared to the above, the historical performance of a 5-Year SIP investment based on the above-mentioned timing logic to time the NIFTY based on NIFTY’s PE Ratio has been as follows:
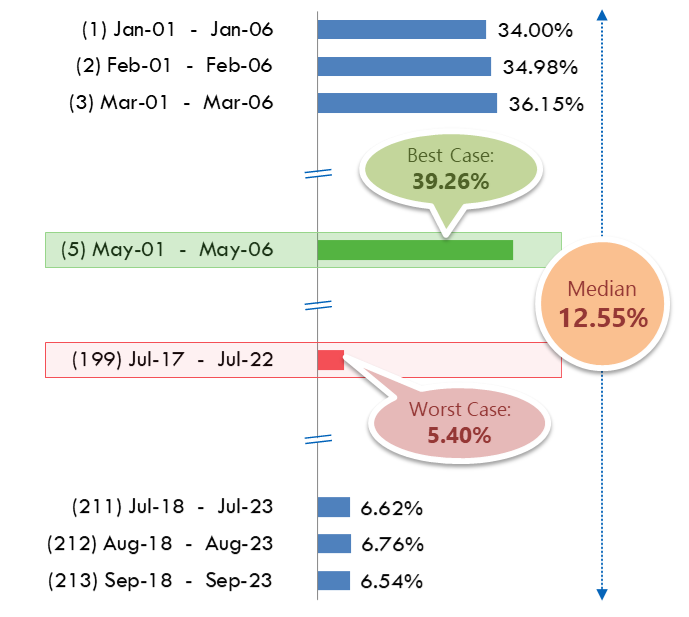

5-Year PE-based SIP in NIFTY-50
Historical Performance (IRR)
(Should NOT be construed as indicative of future returns)
As can be observed above, there’s been a dramatic improvement in the historical worst case performance of a 5-Year SIP investment by introducing an element of timing the investments based on the prevailing PE ratio of the NIFTY (vis-à-vis a conventional 5-year SIP investment in the NIFTY-50).
While a conventional 5-Year SIP can and has historically ended up with an IRR as bad as -5.82% per annum (which happened in the event of the 5-Year SIP ending in the middle of the nearly 40% crash in NIFTY witnessed during the onset of the COVID pandemic around Feb-Mar 2020), a 5-Year SIP based on a timing logic to time the NIFTY based on the NIFTY’s prevailing PE ratio has historically delivered an annualised return (IRR) of +5.4% per annum even in the worst case. This represents an improvement of over 11% age points in the (historical) worst case return (improvement from -5.82% per annum to +5.4% per annum). In effect, this would have meant that investors following the above-mentioned logic to time the NIFTY based on its prevailing PE ratio of the NIFTY would have able to get the best of both worlds – they would have been able to accrue the upside of equity markets during times of strong uptrends in equity markets (the historical best case performance of the strategy has been 39.26% per annum), and yet they would have enjoyed downside protection comparable to that of Bank FDs during times of severe downtrend in equity markets! Can it get better than this?
India's first global-macros driven hedge fund

Address: 307, Indiabulls MINT, Opposite Hiranandani Meadows, Manpada, Thane (West), Maharashtra - 400610 India
© 2026 – metacaps.ai is a registered trademark of ANIINCAPS PRIVATE LIMITED